 I've received some search engine hits by people looking for average snow and rain, so I decided to put some maps on a blog with links. However, before we go that far, I wanted to highlight one factor that helps determine precipitation patterns.
Wisconsin's Topography
The highest elevation in the state is Timm's Hill in Price County at 1,951 ft amsl. Lake Superior is at 600 ft amsl, Lake Michigan is at 577 ft, and the Mississippi River is at 592 ft as it exits the state. The brown area in the northern part of the state is called the Northland Highlands, there is a Central Plain, and the unglaciated area in the southwest corner of the state. Mean elevation is 1050 ft amsl.

In all, there are five geographic provinces in Wisconsin, this link takes you to a great site explaining each area. An alternative elevation map is here.
Average Annual Precipitation
The map (on the right) is pretty self-explanatory. Precipitation is highest in the south and along some of the higher terrain in the Northern Highland. The lowest averages are found in the east-central and northeast.
Highest annual average precip: 36.91 in.
Lake Geneva, Walworth Co. (1961-90)
Lowest recorded annual precip: 12.0 in.
Plum Is, Door Co. (1937)

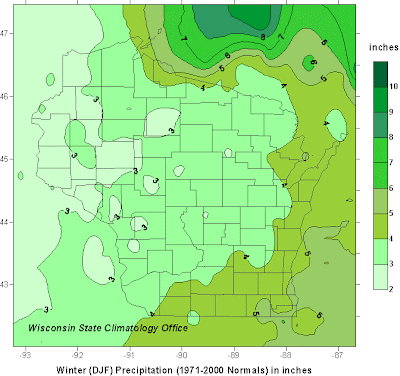
Breaking precip down by season.
Map 1: Spring's (March, April, May) normal 30-year precipitation.
Map 2: Summer's (June, July, August) normal 30-year precipitation.
Map 3: Fall's (September, October, November) normal 30-year precipitation.
Map 4: Winter's (December, January,
 Februa
 ry) normal 30-year precipitation.
More precipitation records:
Greatest daily total: 11.72 in.
Mellen, Ashland Co. (6/24/46)
Greatest Monthly total: 18.33 in.
Port Washington, Ozaukee Co. (June 1996)
Greatest Calendar year: 62.07 in.
Embarass, Waupaca Co. (1884)
Some snowfall records:
Greateast Daily Total: 26 in.
Neillsville, Clark Co. (12/27/1904)
Greatest Storm Total: 31 in.
Superior, Douglas Co. (Oct 31 to Nov 2, 1991)
Greatest Monthly Total: 103.5 in.
Hurley, Iron Co. (Jan 1997)
Greatest Seasonal Total: 277 in.
Hurley, Iron Co. (1996-97)
Greatest Annual Average: 137.5 in.
Gurney, Iron Co. (1961-90)
All these precipitation records can be found on this UW-Extension website.
Online Archived Records
There are two websites that I stumbled upon while creating this post, I didn't know about them previously.
The first is a Climate Data page to access archived monthly and seasonal snowfall and precipitation maps of WI, created by the NWS Milwaukee Office.
The second is the NWS's (New) Precipitation Analysis product.
Looking back into history
Does flooding happen in Wisconsin? Ya sure, you betcha. Here's a page with examples from the DNR.
How about drought? Of course. The Dustbowl was felt in Wisconsin, that's when record high temperatures were set. Here's a page produced by the Mount Washington Observatory.

Wisconsin Average snowfall.
The map (to the right) comes from the NWS Milwaukee Office.
Obviously the highest totals are in the Northern Highlands, across the north-central part of the state. This is mainly due to two factors.
1) Lake Superior creates lake-effect snows in the Autumn and Winter until the water temperature cools off or freezes over.
2) The higher terrain helps focus lake-effect snow bands, as well as general low pressure-systems, but to a lesser degree.
Did I cover everything? If not, e-mail me and I may be able to help you find more information.
Nathan: Nice pictures, graphics, and writing on your blog. I'm very impressed.
ReplyDelete~Michael